Case Study: Moulton Niguel Water District – Evapotranspiration from HydroPoint Data Systems
Submitted by MNWD
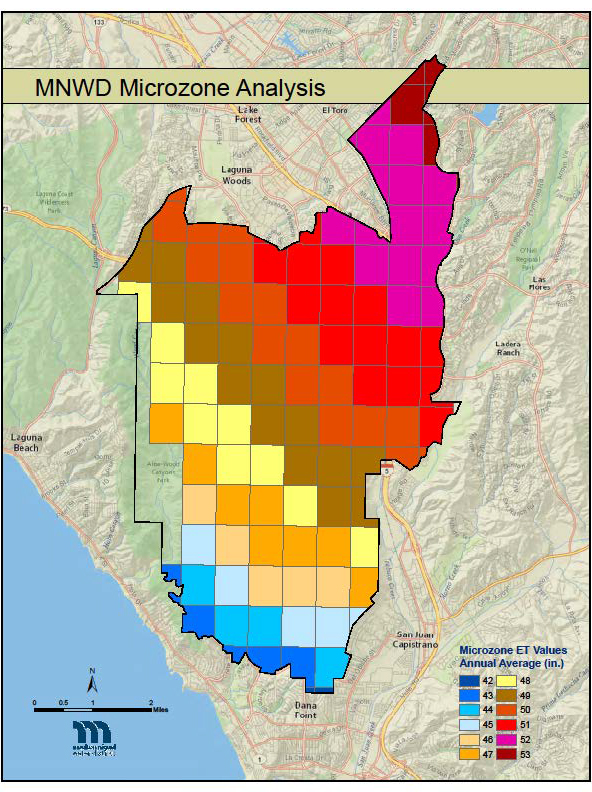
MNWD selected HydroPoint Data Systems to supply the daily ET data required to calculate the BBRs. MNWD’s urban service area ranges in elevation from 140 feet above sea level (ASL) to 930 feet ASL, with recent ETo measurements ranging from 40.2 inches per year to 55.3 inches per year. This variability translates to differing water needs among the different microzones. MNWD’s service area was overlaid with 118 microzones, each one square kilometer in size, as seen in the map below. HydroPoint uses computer-generated climate models to calculate daily ETo for each microzone. HydroPoint employs a team of climate scientists to validate data accuracy from thousands of weather sources including the following: Doppler Radar, NOAA, government and private weather stations, satellite imagery, and atmospheric readings. They use the Penman Monteith method of calculating ET, which is recommended by the Irrigation Association. HydroPoint’s daily delivery of ET has been reliable and easy to incorporate into the billing system.