Case Study:
Eastern Municipal Water District
Evapotranspiration Data from the California Irrigation Management Information System
Submitted by EMWD
As part of EMWD’s BBRs, outdoor water budgets are calculated for each customer based on local ET data collected daily. ET measures in inches of water per square foot per day what is lost to the atmosphere by the combined processes of evaporation (from soil and plant surfaces) and transpiration (from plant tissues). Many factors effect daily ET measurements, such as solar radiation, air temperature, relative humidity, and wind speed.
When EMWD implemented its BBRs in 2009, daily ET data was supplied by a private company. In 2013, staff noted that the loss of a local CIMIS station resulted in a noticeable increase in the daily calculated ET. To improve the accuracy of daily ET used in its BBRs, EMWD shifted its source of ET data to Water Budget-Based Rates: How-To Resource Guide August 2016 52 CIMIS and installed three additional CIMIS stations throughout the service area. CIMIS stations are sighted using stringent criteria to represent ideal conditions. It took several months for EMWD staff to locate appropriate sites and put into place agreements and easements for the maintenance and location of the CIMIS stations.
EMWD uses Spatial CIMIS, which calculates ET at a 2 kilometer spatial resolution, for billing its customers. Currently within EMWD’s service area, there are five weather stations used for ET determination (see area stations in the map). The station in Temecula is maintained by DWR and RCWD. EMWD found sites and invested in the equipment for new stations in Moreno Valley, Perris, and Hemet, and maintains these stations along with a previously existing station in Winchester. These CIMIS stations provide excellent coverage across EMWD’s water service area and are helping to provide improved data, accuracy for calculating ET, and budget allocations in customer water bills. Pictures of some of the stations are included in a collage of images.
The monthly maintenance EMWD performs includes: taking visuals of the site to ensure the station is tamper free, confirming that the turf is the proper height, and providing adjustment to the irrigation if needed. In addition, all sensors are cleaned and checked to ensure information is transmitting properly, reads are taken, and a report of the information is sent to DWR.
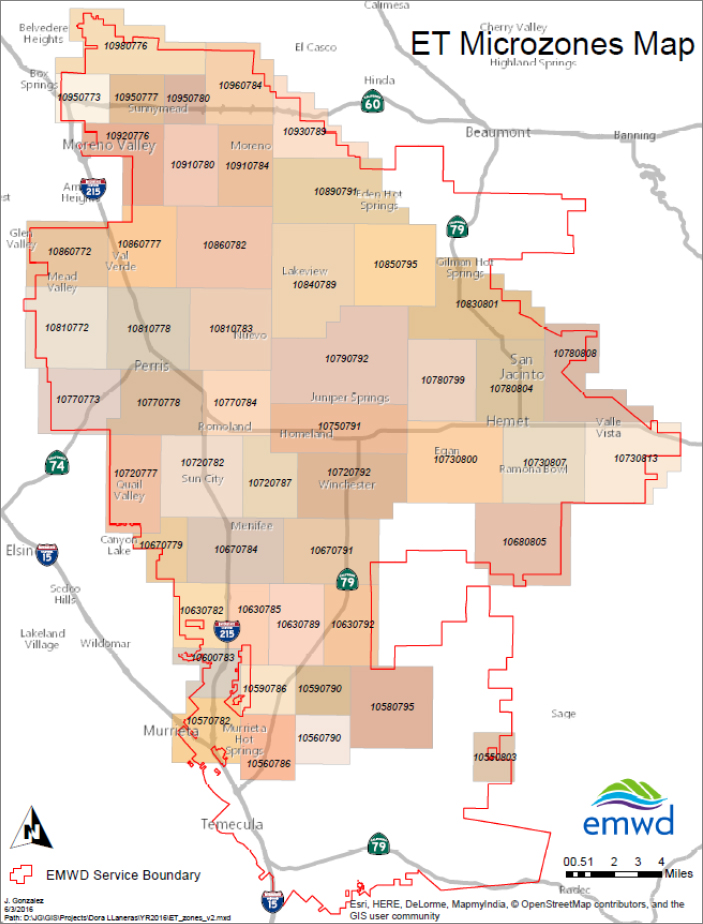
Each day, ET data for 50 areas (microzones) across EMWD are collected from Spatial CIMIS System (see map below). EMWD uses a Web API, managed by DWR, to retrieve and store the data for use in the billing process. Each of the 50 areas has an assigned latitude and longitude and each EMWD meter that is on water budgets is assigned to one of the 50 areas. If for any reason EMWD is unable to retrieve the data, EMWD will substitute historic ET from the Winchester CIMIS Station. EMWD updates historic ET once a year in the billing system.