Valencia Water Company
Meter Impact Studies
The Residential Meter Impact Study (ReMIS) was developed during the initial design phase of the VWC’s BBRs implementation program. The scope of the ReMIS enables VWC to test how specific program variables and variable changes impact water rates for customers, as well as identify any impacts that such changes might have on VWC’s revenues. The ReMIS has proved to be highly valuable tool for VWC’s Water Conservation department. VWC developed the High Consumption Letter (HCL) Program using the data analyzed in the ReMIS. After each billing cycle, VWC staff compiles a report that identifies customers with water consumption in excess of 185% of their monthly allocation. These customers are sent a HCL to “grab” their attention and motivate participation in water audits and other conservation programs.
VWC initially developed the Dedicated Irrigation Meter Impact Study (DIMIS) during the DIM/DIM-MS BBR structure’s pre-application process. It was used to study plausible impacts customers might encounter post execution of the program and to determine the impact on VWC’s revenues. VWC utilizes the DIMIS on a monthly basis to determine available conservation opportunities and to take proactive measures to assist our customers with their conservation goals. The DIMIS as a data tool assists in conservation marketing and outreach efforts, which enable VWC to quickly find and locate customers with high water savings potential.
Residential Customers
The Residential Meter Impact Study (ReMIS) was developed during the initial design phase of the VWC’s BBRs implementation program. The scope of the ReMIS enables VWC to test how specific program variables and variable changes impact water rates for customers, as well as identify any impacts that such changes might have on VWC’s revenues. The ReMIS collects the following data for each residential customer:
- Customer Number
- Customer Name
- Service Number
- Assessor’s Parcel Number
- Sales Class
- Meter Number
- Previous and Present Meter Read Dates
- Total Monthly Consumption
- Year, Month and Number of Days in the Billing Period
- ET
- Landscaped Areas
- Monthly Water Allocation
- Allocation Use in%
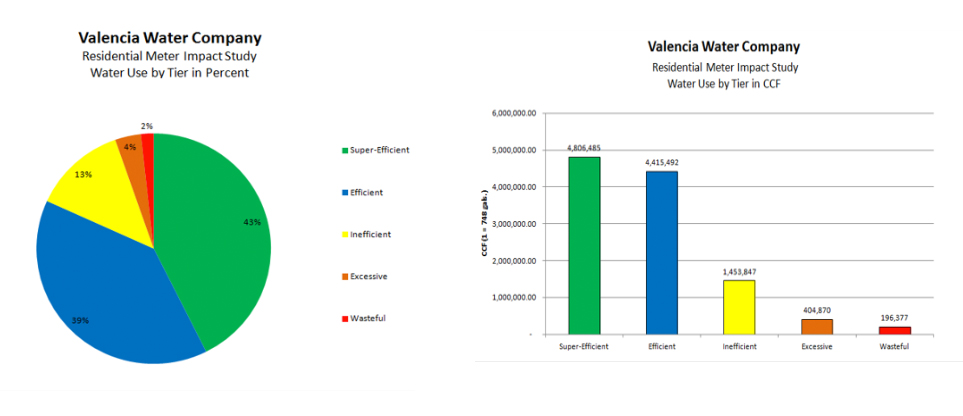
In addition to the data points listed above, the ReMIS enables VWC to collect information on the performance of the allocations and tiered rates from a broad perspective. During the 24 month assessment period from August 1, 2010 to June 30, 2012, the water use by tier was: 43% of total water sales in Tier 1 (Super-Efficient), 39% in Tier 2 (Efficient), 13% in Tier 3 (Inefficient), 4% in Tier 4 (Excessive), and 2% in Tier 5 (Wasteful). For this study, the ReMIS calculated that 82% of VWC’s total water sales fell into Tiers 1 and 2, or within the majority of customer’s water allocation. During the same period of time, the water use in ccf (1 ccf = 748 gallons) was itemized. VWC’s residential customers had 4,806,485 ccf in Tier 1; 4,415,492 ccf in Tier2; 1,453,847 ccf in Tier3; 404,870ccf in Tier 4; and 196,377ccf in Tier 5.
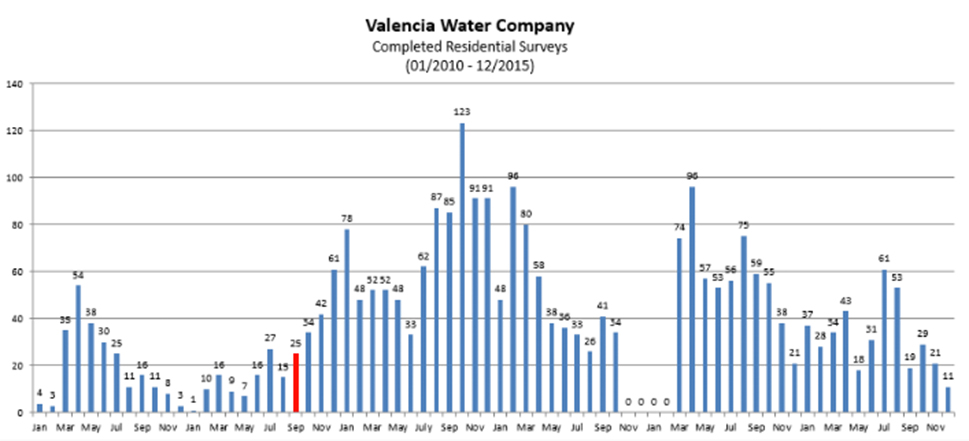
The ReMIS has proved to be highly valuable tool for VWC’s Water Conservation department. VWC developed the High Consumption Letter (HCL) Program using the data analyzed in the ReMIS. After each billing cycle, VWC staff compiles a report that identifies customers with water consumption in excess of 185% of their monthly allocation. These customers are sent a HCL to “grab” their attention. The HCL reinforces that the customer is significantly over their monthly allocation and that VWC is here to provide assistance to help the customer achieve their water use efficiency goals. Since the HCL Program started in September 2011, VWC has seen a 270% increase in customer participation of the Residential Check-Up Program and related water savings.
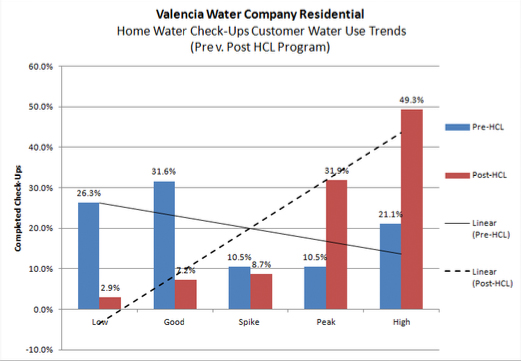
In addition to increased participation rates and because the program targets high-use customers with greater water savings potential, VWC has seen a dramatic shift in participating customers’ water use trends. Prior to the HCL Program, the majority of customer requests originated from customers with water consumption that would be considered either lower than their allocation (Super-Efficient) or generally good (Efficient). As shown below, customers with either high or peak (Excessive of Wasteful) historical water use trends account for the bulk of survey requests and add to the success of conservation efforts, increase the program’s cost benefit ratio, and reduce customers’ overall water costs. This would not have been possible without VWC’s BBRs, which provide customers with monthly water allocations to compare to their actual use.
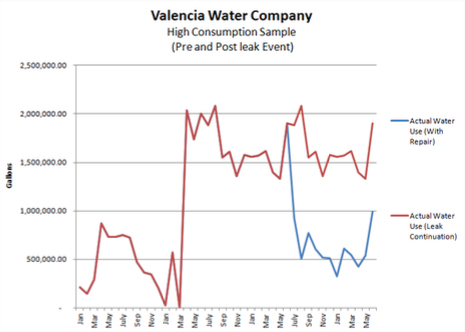
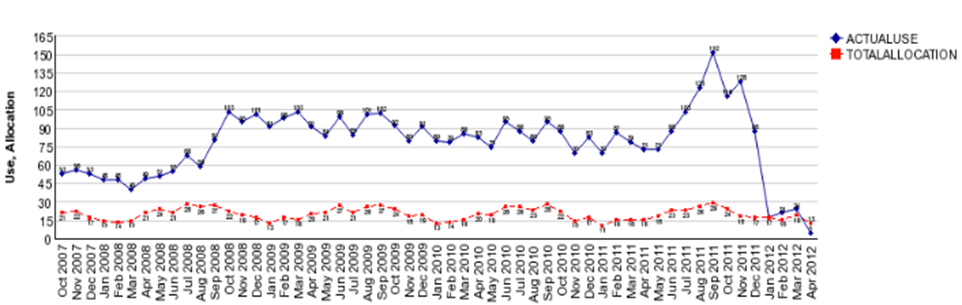
In one case, after receiving a HCL, a customer with historically high water use consumption requested assistance from VWC’s conservation staff. The customer’s water use history demonstrated that there had been a significant amount of water loss dating back to October 2007. Conservation staff visited this customer in November 2011 and discovered that a faulty water softening unit was the source of the leak. The unit was no longer functioning properly and was wasting about 2,900 gallons per day. The leak repair has reduced this customer’s monthly water use from approximately 89,000 gallons per month to 14,000 gallons per month, for a monthly water savings of 75,000 gallons (see figure below). This leak (water waste) would not have been discovered if it weren’t for the ability of the customer to compare their actual water use to what their water should be based on the BBR structure’s monthly allocation.
Dedicated Irrigation Meter Customers
VWC initially developed the Dedicated Irrigation Meter Impact Study (DIMIS) during the DIM/DIM-MS BBR structure’s pre-application process. It was used to study plausible impacts customers might encounter post execution of the program and to determine the impact on VWC’s revenues. The DIMIS collects the following monthly data for each DIM/DIM-MS customer:
- Customer Number
- Customer Name
- Service Number
- Assessor’s Parcel Number
- Sales Class
- Meter Number
- Previous and Present Meter Read Dates
- Total Monthly Consumption
- Year, Month and Days in Billing Period,
- ET
- Landscaped and Special Landscaped Areas
- Monthly Water Allocation
- Allocation Use in%
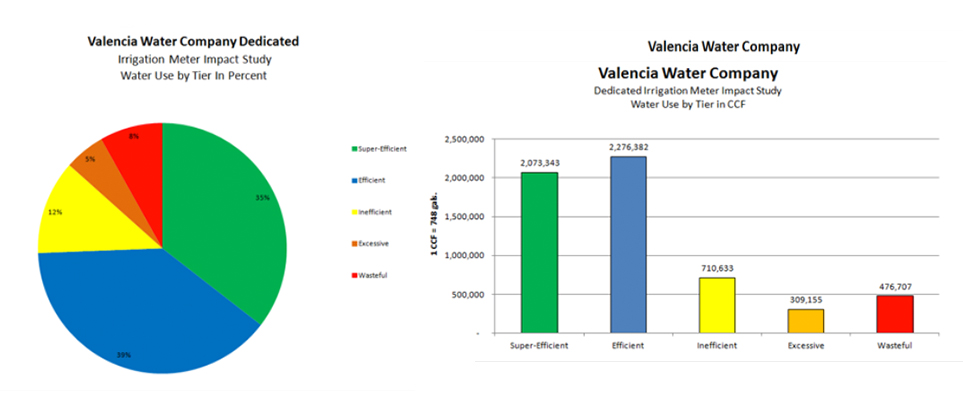
Data output from the DIMIS incorporates macro and micro consumption and frequency by tier. It can also test various scenarios including the impacts of modifying specific program variables such as tier widths, crop coefficients, and irrigation efficiencies. In addition, the DIMIS enables VWC to collect information on the performance of the allocation and tiered rates from a broad perspective. Water use by tier is summarized for the study period: 35% of total water sales were in Tier 1 (Super-Efficient), 39% in Tier 2 (Efficient), 12% in Tier 3 (Inefficient), 5% in Tier 4 (Excessive), and 8% in Tier 5 (Wasteful). For this study, the DIMIS calculated that 74% of VWC’s total water sales fell into Tiers 1 and 2 or within the majority of customer’s water allocation. DIMIS also itemizes water use in ccf (1 ccf = 748 gallons). During the DIMIS sampling period, VWC’s DIM/DIM-MS customers had 2,073,343 ccf in Tier 1; 2,276,382 ccf in Tier 2; 710,633 ccf in Tier 3; 309,155 ccf in Tier 4; and 476,707 ccf in Tier 5.
VWC utilizes the DIMIS on a monthly basis to determine available conservation opportunities and to take proactive measures to assist our customers with their conservation goals. The DIMIS as a data tool assists in conservation marketing and outreach efforts, which enable VWC to quickly find and locate customers with high water savings potential. In one example in 2011, VWC was able to locate a customer with consumption far greater than his or her water allocation. VWC worked with the customer to locate and repair the leak and provided education and training on how detect and respond similar issues in the future. Since the leak was repaired, the customer has saved approximately 17,032,000 gallons of water.
VWC provides copies of the DIMIS with account specific data for large account holders. These customers often have many accounts and often lack the resources necessary to track water use by account and by allocation. This tool provides the respective accounts with their first real comprehensive look at their water use by site compared to a site specific water allocation, and assists with their water use efficiency improvement processes.