The First Budget-Based Rates Implementation
Submitted by Tom Ash
The first agency to design and implement BBRs was IRWD in 1991. The rate redesign was prompted by a Board request to fix the current (i.e., 1990) rate structure. Starting January of 1991, IRWD contracted with the University of California, Riverside to bring a water and horticulture extension advisor (Tom Ash) to the District to assist staff with the redesign effort and subsequent public education.
IRWD started the rate structure evolution in July 1990 by changing the percentage of fixed costs being collected on the fixed service (i.e., meter) charge. Up to July 1990, IRWD employed a common cost recovery scenario of a low fixed charge with the majority of fixed costs and all variable costs going into the volumetric rate. This breakdown meant that 25% of fixed costs were collected on the fixed service charge while the remaining 75% of fixed costs were shifted to the variable or volumetric side of the water bill. It is important to note that, for most water agencies, the majority of costs are fixed (e.g., 75% for IRWD). In IRWD’s case, a low fixed charge meant that only 25% of fixed costs were reliably recovered on the fixed service charge. With the majority of fixed costs allocated to the variable volumetric rate, fixed cost recovery was at significant risk of being lost with any reduction in water use and sales. During the drought that lasted from 1987 to 1992, IRWD started to lose significant fixed revenue due to lower water sales, which prompted the Board of Directors to ask for a rate structure fix.
Also contributing to the redesign request, Metropolitan Water District adopted Tier 2 pricing for imported water and the Tier 2 price was based on any water purchased by an agency over its 1989 use level. At that time, IRWD imported approximately 65% of its water.
The IRWD Board and staff did not consider conservation a short-term problem, but a long-term necessity. This allowed staff to think differently and consider how to meet the Board’s three main criteria:
- Save water without losing money (i.e., revenue stability)
- Create a “conservation ethic” (i.e., California would have more droughts and being efficient with
water use in both wet and dry periods was the right thing to do) - Be fair and equitable to customers in all classes
Revenue stability was immediately achieved by changing the fixed cost percentage from 25% to 70% on the service charge in July 1990. The remaining fixed costs, 30%, were imbedded into the efficiency tiers (Tier 1 or Low Volume Conservation and Tier 2 or Base Rate) where efficiently used water was most likely to be sold. The result of changing the recovery of fixed costs was immediately stabilizing the recovery of fixed costs.
The solution to creating a conservation ethic was setting a science-based target for efficient and/or necessary water use. Solving for this criteria included using sewer flows to estimate typical indoor water use; it was found that customers used approximately 75 GPCD indoors during the drought. Therefore, the indoor water need equation is:
Indoor Water Budget = Number of Residents × 75 GPCD
Estimating outdoor water need required a more sophisticated approach and data. The resulting outdoor allocation of water was developed through the use of a University of California, Riverside equation for landscape and agricultural water budgets. The outdoor water need equation is:
Outdoor Water Budget = ET × Landscape Area
In 1991, 100% of local ET was considered the standard for efficient outdoor water use.
The first BBR structure added the indoor water budget to the outdoor water budget to calculate an efficient target for water use.
The final criteria (i.e., be fair and equitable to customers) led the rate structure team to consider a wide range of customer situations, including small and large lots, the different micro-climates across the District’s service area, and the application of water budgets across all customer groups including agriculture, commercial, and institutional customers.
The solution to create a fair and equitable rate structure featured the following elements:
- For fairness, utilize the water budget formula for each customer class (e.g., commercial customer water budgets were developed with a separate allocation approach, but with the same number of tiers and prices to make all customers groups responsible for water use efficiency)
- For equity (defined as impartial, just, fair, and evenhanded), establish individualized water budgets for each account (Today, the same formula for equitable water efficiency targets is found in State legislation, SBx7-7, and MWELO)
At IRWD in 1991, as with any agency, there is a wide variety of customer situations, including family size, lot size, and weather. By creating the billing system’s ability to individualize the water budget for every customer within a customer class and by using the water budget formula introduced above, the BBR structure gave each customer a tailored allocation that fit their specific needs. The same formula was used for the single family residential, condo, and apartment customer classes, as well as every dedicated landscape meter (whether using potable or recycled water sources) and agricultural accounts, which in 1991 were significant water users in IRWD. Agriculture accounts were grouped by crop type to allow for each farmer to have a crop specific water budget. The ET in the outdoor was budget formula was adjusted to match the crop coefficients for each farmer’s plantings and also included water for soil preparation and frost protection. This allowed farmers to be treated like any commercial business by establishing water budgets based on their business (i.e., crop type).
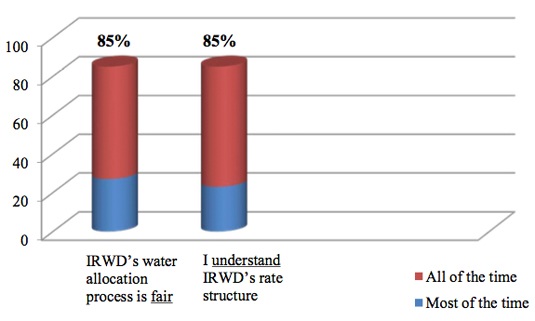
In all customer classes, and especially the agriculture and commercial classes, customers appreciated that IRWD recognized their specific situation and calculated and established water budgets based on their business needs. Individualizing the residential water budgets made perfect sense to residential customers with regards to family size, landscape size, and if they had a pool or other unique water needs. An IRWD “Voice of the Customer” survey in 1997 asked “Do you understand the IRWD rate structure?” and “Do you think the rate structure is fair?” For both questions, 85% of survey takers responded with positively.
IRWD finalized the rate design and adapted the billing system internally to accommodate increased customer classes, customer class formulas, individualized customer level data (e.g., number of residents, landscape area), daily ET inputs for three major micro-climates, and variances.
Staff tested the impact of the BBR on different customer classes. A primary goal was to review the impact on seniors in a specific development area. It was found that bill totals for seniors would largely go down, while bills for those who wasted water would increase exponentially due to the charges in the penalty or over-allocation use tiers.
The first BBR structure was designed and implemented before the passing of Proposition 218. While IRWD presented the new rate structure in numerous board meetings, there was no customer protest at any meeting, nor was there an official vehicle for customer protest as is now offered in Proposition 218.
At the same time, there was no regulatory guideline for setting tier prices as there is today with Proposition 218. The rationale for setting tier prices, however, did have a similar logic as is sought in Proposition 218. There was a desire to recover the full cost of service with the rates, while driving customers to use water efficiently. The lowest cost water set the basis for the cost for the lowest or first tier. The next highest cost water set the basis for the second tier. The first and second tiers were considered to be the efficiency tiers. Tiers 3, 4, and 5 were considered overuse or penalty tiers. The prices set for the penalty tiers were based on the costs estimated to bring the next sources of water into the service area. The prices for the three penalty tiers doubled in each tier, with the highest tier price being eight times the cost of the base rate tier. The following image is an example customer bill, showing the billing date (ET for each day of the billing cycle was input for billing periods), the size of the landscape area, the allocation for the specific customer for the billing period, and the water use in CCF:
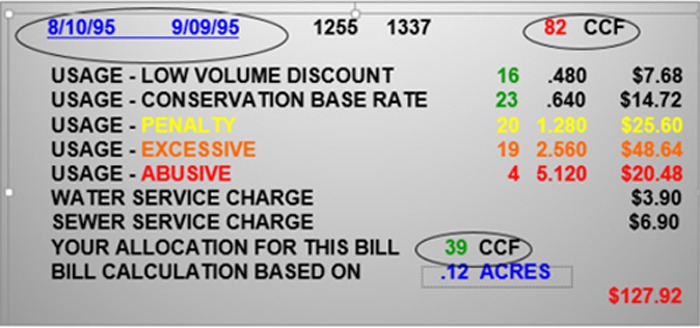
This example also shows tier naming. Naming the tiers was one of the most valuable and helpful features of the first BBR design. With a simple bill design, customers would see their allocation, their use and be alerted to over water use by both the price paid per tier, but also how the use per tier related to efficient water use via the names. More customers called IRWD due to being called a name (e.g., abusive) than by the price of water in the highest tier (eight times the base rate cost).
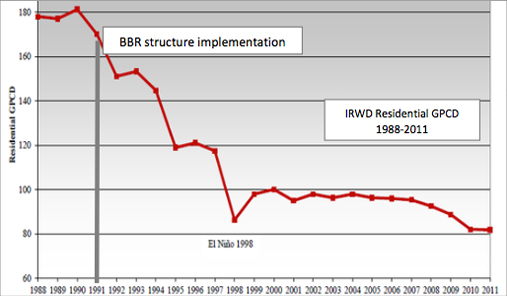
The combination of accurate individualized allocations, steep tiered pricing, and naming the tiers based on relative water use achieved the goal to get the attention of customers. Water use dropped significantly due to implementation of BBRs at IRWD. See the Residential GPCD use for approximately 23 years below:
The overall impacts of the first BBR structure implementation included:
- Stable agency recovery of fixed costs
- Significant customer education directly from the water bill
- Rapid water use reduction, even after the drought ended in 1992
- Consistent water use efficiency over 2 decades (and counting)
- Significant excess revenue collected from penalty tier charges and used specifically for a wide range of conservation programs paid only by those who wasted water
- High customer acceptance (85%)
- Elected officials continue to be re-elected over the past 2 decades